Congruence Engine investigations
Saltaire Phase 2 - Household Genealogies and Education
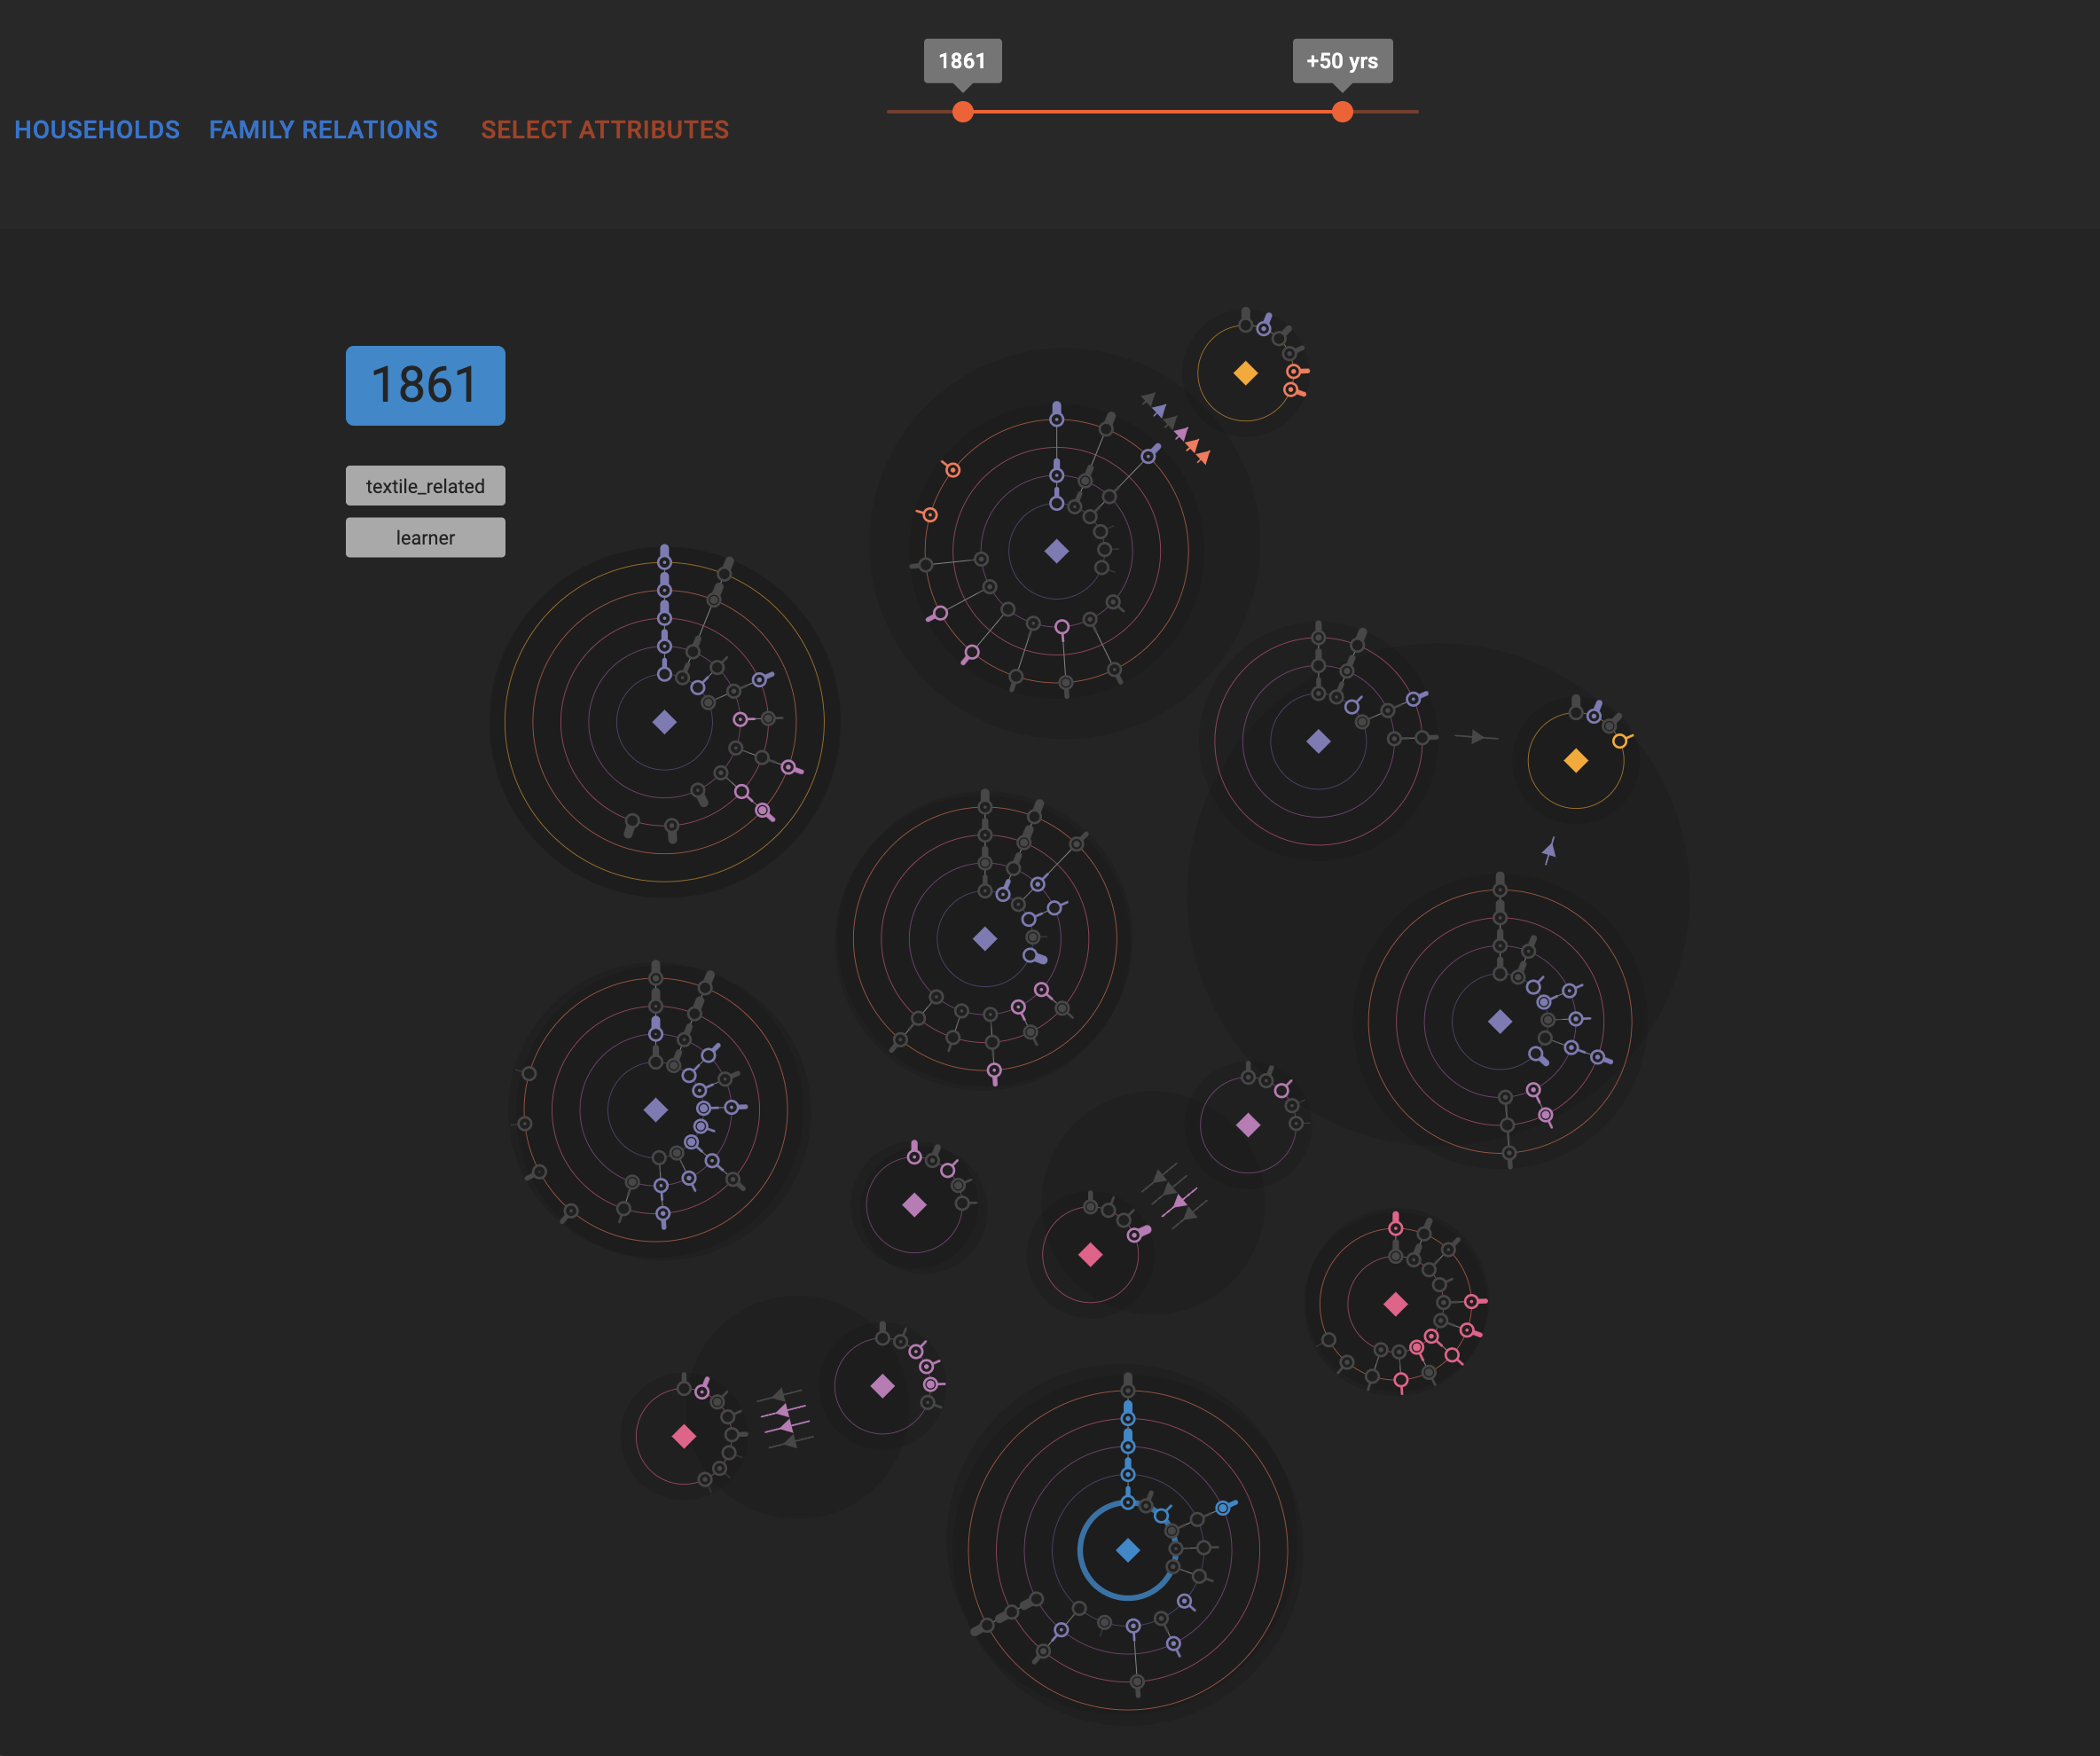
Short summary
The visualisation design follows principles of ‘subject in transit’ (Butterworth 2022) and, as such, is conceived in relation to a suite of exploratory data visualisation formats representing contexts between which subject focalisation is carried, allowing fluid movement through complex semantic datascapes.
Research questions
-
How is it possible to use computational methods to generate full graphs for family genealogies and household genealogies, over several decades, based on census records?
-
How can data science methods of graph analysis generate new knowledge from such graphed data, in relation to the social history of individuals (family context and career trajectories, etc), households (complex factors determining various outcomes) and communities?
-
What are the respective insights that can be derived from a study of the occupations of members of an industrial (model) town as classified according to Booth-Armstrong categories and by an Occupations Ontology?
-
What research benefits can be derived from linking this remodelled census/community data to collections and archive data – educational reports, examples of machinery worked with – and how is this best effected?
-
What new forms of data visualisation are required to provide the most direct and effective access to the exploratory analysis of this remodelled data?
People
Alex Butterworth
Visualisation, Conceptualisation, Formal Analysis, Investigation, Methodology, Writing – original draft
Colin Coates
Resources, Data Curation, Formal Analysis, Investigation, Writing – review & editing
Nayomi Kasturchi-Arachchi
Conceptualisation, Formal Analysis, Software, Validation, Investigation, Methodology, Writing – original draft
Jo Kent
Conceptualisation, Formal Analysis, Investigation, Writing – original draft
Denice Penrose
Data Curation
Felix Needham-Simpson
Data Curation
Andrew Richardson
Visualisation, Conceptualisation, Investigation, Methodology, Software, Writing – original draft
Data sources (used or developed)
-
Private data sources loaned by Colin Coates from his personal research and transcribed material (primarily census records for six decades from 1861, analysis of housing in Saltaire town, biographies developed from newspaper and other records, and a range of analysis undertaken on these materials)
-
A remodelling of this private data (which inherits that status) as a full relationship graph and genealogical model of household heads and dependents
-
Use of extended Booth-Armstrong method (previously developed by Jo Kent).
-
School and scholarship records from Saltaire, sourced from the West Yorkshire Archive
Investigation methods/ tools/ code/ software (used or developed)
• Preprocessing routines for source data, developed in Python and contained in 2 Jupyter notebooks. • Neo4j graph construction routine developed in Python and contained in a third Jupyter notebook. • Neo4j graph of the census data plus additional information on occupations.
• Initial data analysis to identify occupations not represented in the Booth Armstrong class and industry mapping • Normalisation of occupations as listed and mapping to classes and industry sectors • Processing of data using Jupyter notebooks to create household class mappings over time
• Community and identify analysis of graphed data for individuals and households.
• Note: whilst the Jupyter notebooks are shared to expose methodology, the actual graph cannot be made publicly accessible as any downloading of it would expose the source data, the majority of which we do not own.
Outputs
-
Prototype exploratory data visualisation interface for household genealogies, involving novel components integrated to supporting prior codebase.
-
Chapter in ‘Emergent Histories’ book, ‘Saltaire Genealogies’
Licence
This work is licensed under a Creative Commons Attribution 4.0 License - CC BY 4.0.